


The period just before and around Diwali is always peak shopping season in India. Over the last two years it has become a bellwether event for online retail with all of India’s major e-commerce companies running massive festive sales just preceding and during the festive season. Last year, for instance, Indian consumers bought over $1 billion worth of merchandise online during October. Diwali sales also drive the largest influx of new consumers into the online market, thus becoming the defining event for the next year’s growth.
This spike in sales comes with unique challenges for e-commerce companies, consumers and the entire internet ecosystem. For instance, fulfilment companies focused on online retail are severely stretched while suddenly having to deal with double or triple their normal volumes in a 15-20 day period while continuing to meet the expectations of demanding consumers.
For this article we examine three central questions which we believe are critical to both online retailers as well as fulfilment companies during peak season:
- Where is demand coming from and how has it changed in the last two years?
- What products are consumers likely to shop for?
- How do e-commerce companies and their fulfilment partners use this detailed analysis?
We forecast demand for 417 cities across the country, from the metros all the way to small towns like Koppa in Karnataka, inhabited by ~5,000 people. Our analysis is based on over 4,000 statistical models that accommodate for category growth in terms of new users and products and consumer behaviour trends observed over the last five years. The timeline for the analysis is the entire month of October 2016.
First, the top-line number
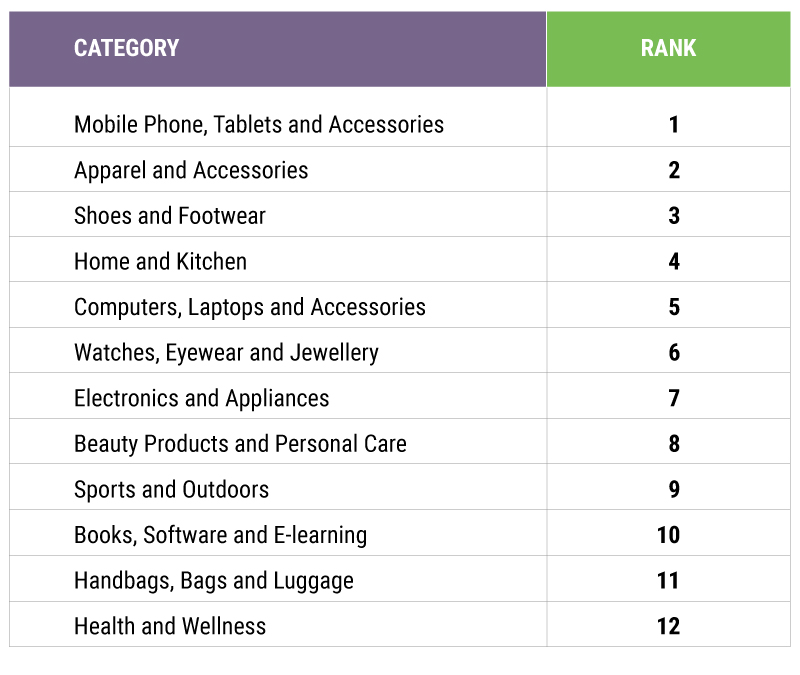
This Diwali, we expect Indian consumers will spend over Rs 12,000 crore ($1.8 billion) online. The top categories are no surprise; we expect them to be Mobiles/Tablets/Computers, Apparel and Accessories, Shoes and Footwear, Home and Kitchen and Computers, Laptops and Accessories.
Where will demand come?
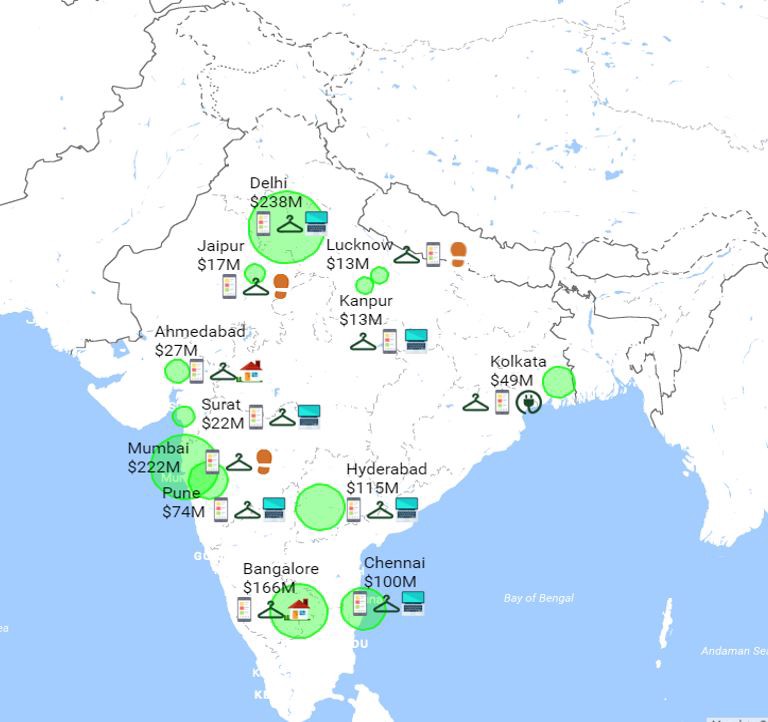
The 417 cities we studied have a total population of 252 million; of which about 61 million shop online. The top six cities in India: Delhi, Mumbai, Bangalore, Hyderabad, Chennai and Pune, with a combined population of over 70 million consumers, will continue to form the largest part of the e-commerce market. Delhi, Mumbai and Bangalore are expected to form over a third of e-commerce consumption, with Hyderabad, Chennai and Pune forming close to another 18%.
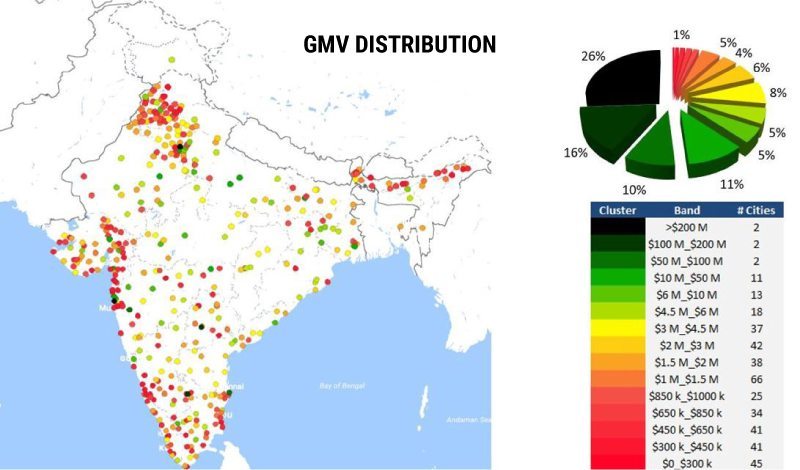
While the market is still skewed towards the metros and the larger cities it is worth noting that two years ago, the same set of six cities formed well over 70% of the Indian e-commerce market. It is quite evident that e-commerce is now rapidly spreading across the country. For instance, beyond the top six cities there are 11 cities that we expect will be $10-$50 million (Rs 65-325 crore) markets, 13 cities between $6-10 million (Rs 40-65 crore) and 201 cities which will be at least $1 million sized markets (Rs 6.5 crore).
Slowdown? What slowdown?
While Figure 2 shows a wide distribution in the total spend in different cities across the country, this is also an artifact of the fact that the 400+ cities listed we analysed have a population ranging from almost touching 20 million (Delhi/Mumbai) to ~5,000 for Koppa. When normalised for total population of each city, we find that the spend is more uniform. Our analysis suggests that per capita spend in the top metros is of the order of Rs 858 which is starkly higher than the comparable number for the remaining cities where the spend varies between Rs 282 and Rs 407.
When corrected for shopping frequency this is particularly interesting since it suggests that 8-10% of the population of even smaller cities in India is already shopping online and 15-20% of the population of the metro cities is shopping online. Despite the grumblings of some well-known offline retailers about online being a discount-driven fad and the nervousness around e-commerce earlier this year what is clear is that e-commerce is here to stay!
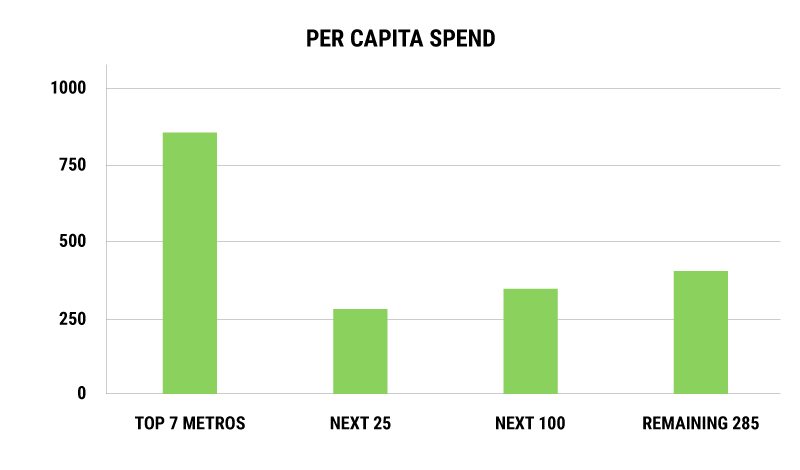
Figure 4 shows the top three product categories we forecast e-commerce shoppers to buy, along with the total spend in a city, for the top dozen cities.
For e-commerce companies it is important to know which cities shoppers are going to spend more money in. Along with category information this enables city or region specific deals and promotions, efficient placement of merchandise at the appropriate warehouses and faster fulfilment timelines.
How do we use this analysis?
Why spend many man-months collecting and cleansing data, building 4,000+ models, validating and refining them?
As a quick example, at Delhivery we use this analysis to optimise our line-haul network, especially on inter-city long-haul truck routes by identifying high demand clusters/cities and flow of goods. Within local clusters we also use granular locality-level demand projections to determine staffing and vehicle requirements for delivery stations. Product category visibility also guides investment in category-specific infrastructure like x-ray machines for high-value phones and forklifts for heavy products.
For the e-commerce players and their partners, vendors and suppliers, application of analyses like this are numerous.
- Better targeting: Category pricing and promotions can be customised for specific groups of consumers in specific locations
- Inventory optimisation: Stock purchase and distribution can be optimised based on demand
- Faster fulfilment: Locating products closer to demand, especially for categories like heavy products like furniture and appliances (frequently purchased during Diwali) can dramatically reduce fulfilment costs while maintaining short delivery timelines
Happy Diwali!
Note: We recognise that as a third party service provider the data we analyzed on orders delivered to consumers may contain some biases (in a definite time-frame). However the statistical insights are not significantly different in analyses done at different time points and therefore we believe the biases are small enough to not alter our findings materially.
Subscribe to FactorDaily
Our daily brief keeps thousands of readers ahead of the curve. More signals, less noise.
To get more stories like this on email, click here and subscribe to our daily brief.
Graphics: Nikhil Raj Acknowledgement: The post is possible due to the extremely detailed and diligent work by Snigdha Gupta, Aditi Sharma, Swarnim Shrishti, and Harshit Agarwal with the guidance of our CEO Sahil Barua and CTO Kapil Bharati. For full disclosure, Delhivery is India’s leading third party eCommerce logistics provider.


